Metrics
The Metrics page is the dashboard's home for both users (their own throughput) and admins (tenant-aggregate). It's built from in-process counters + 24 h of persisted minute-buckets.
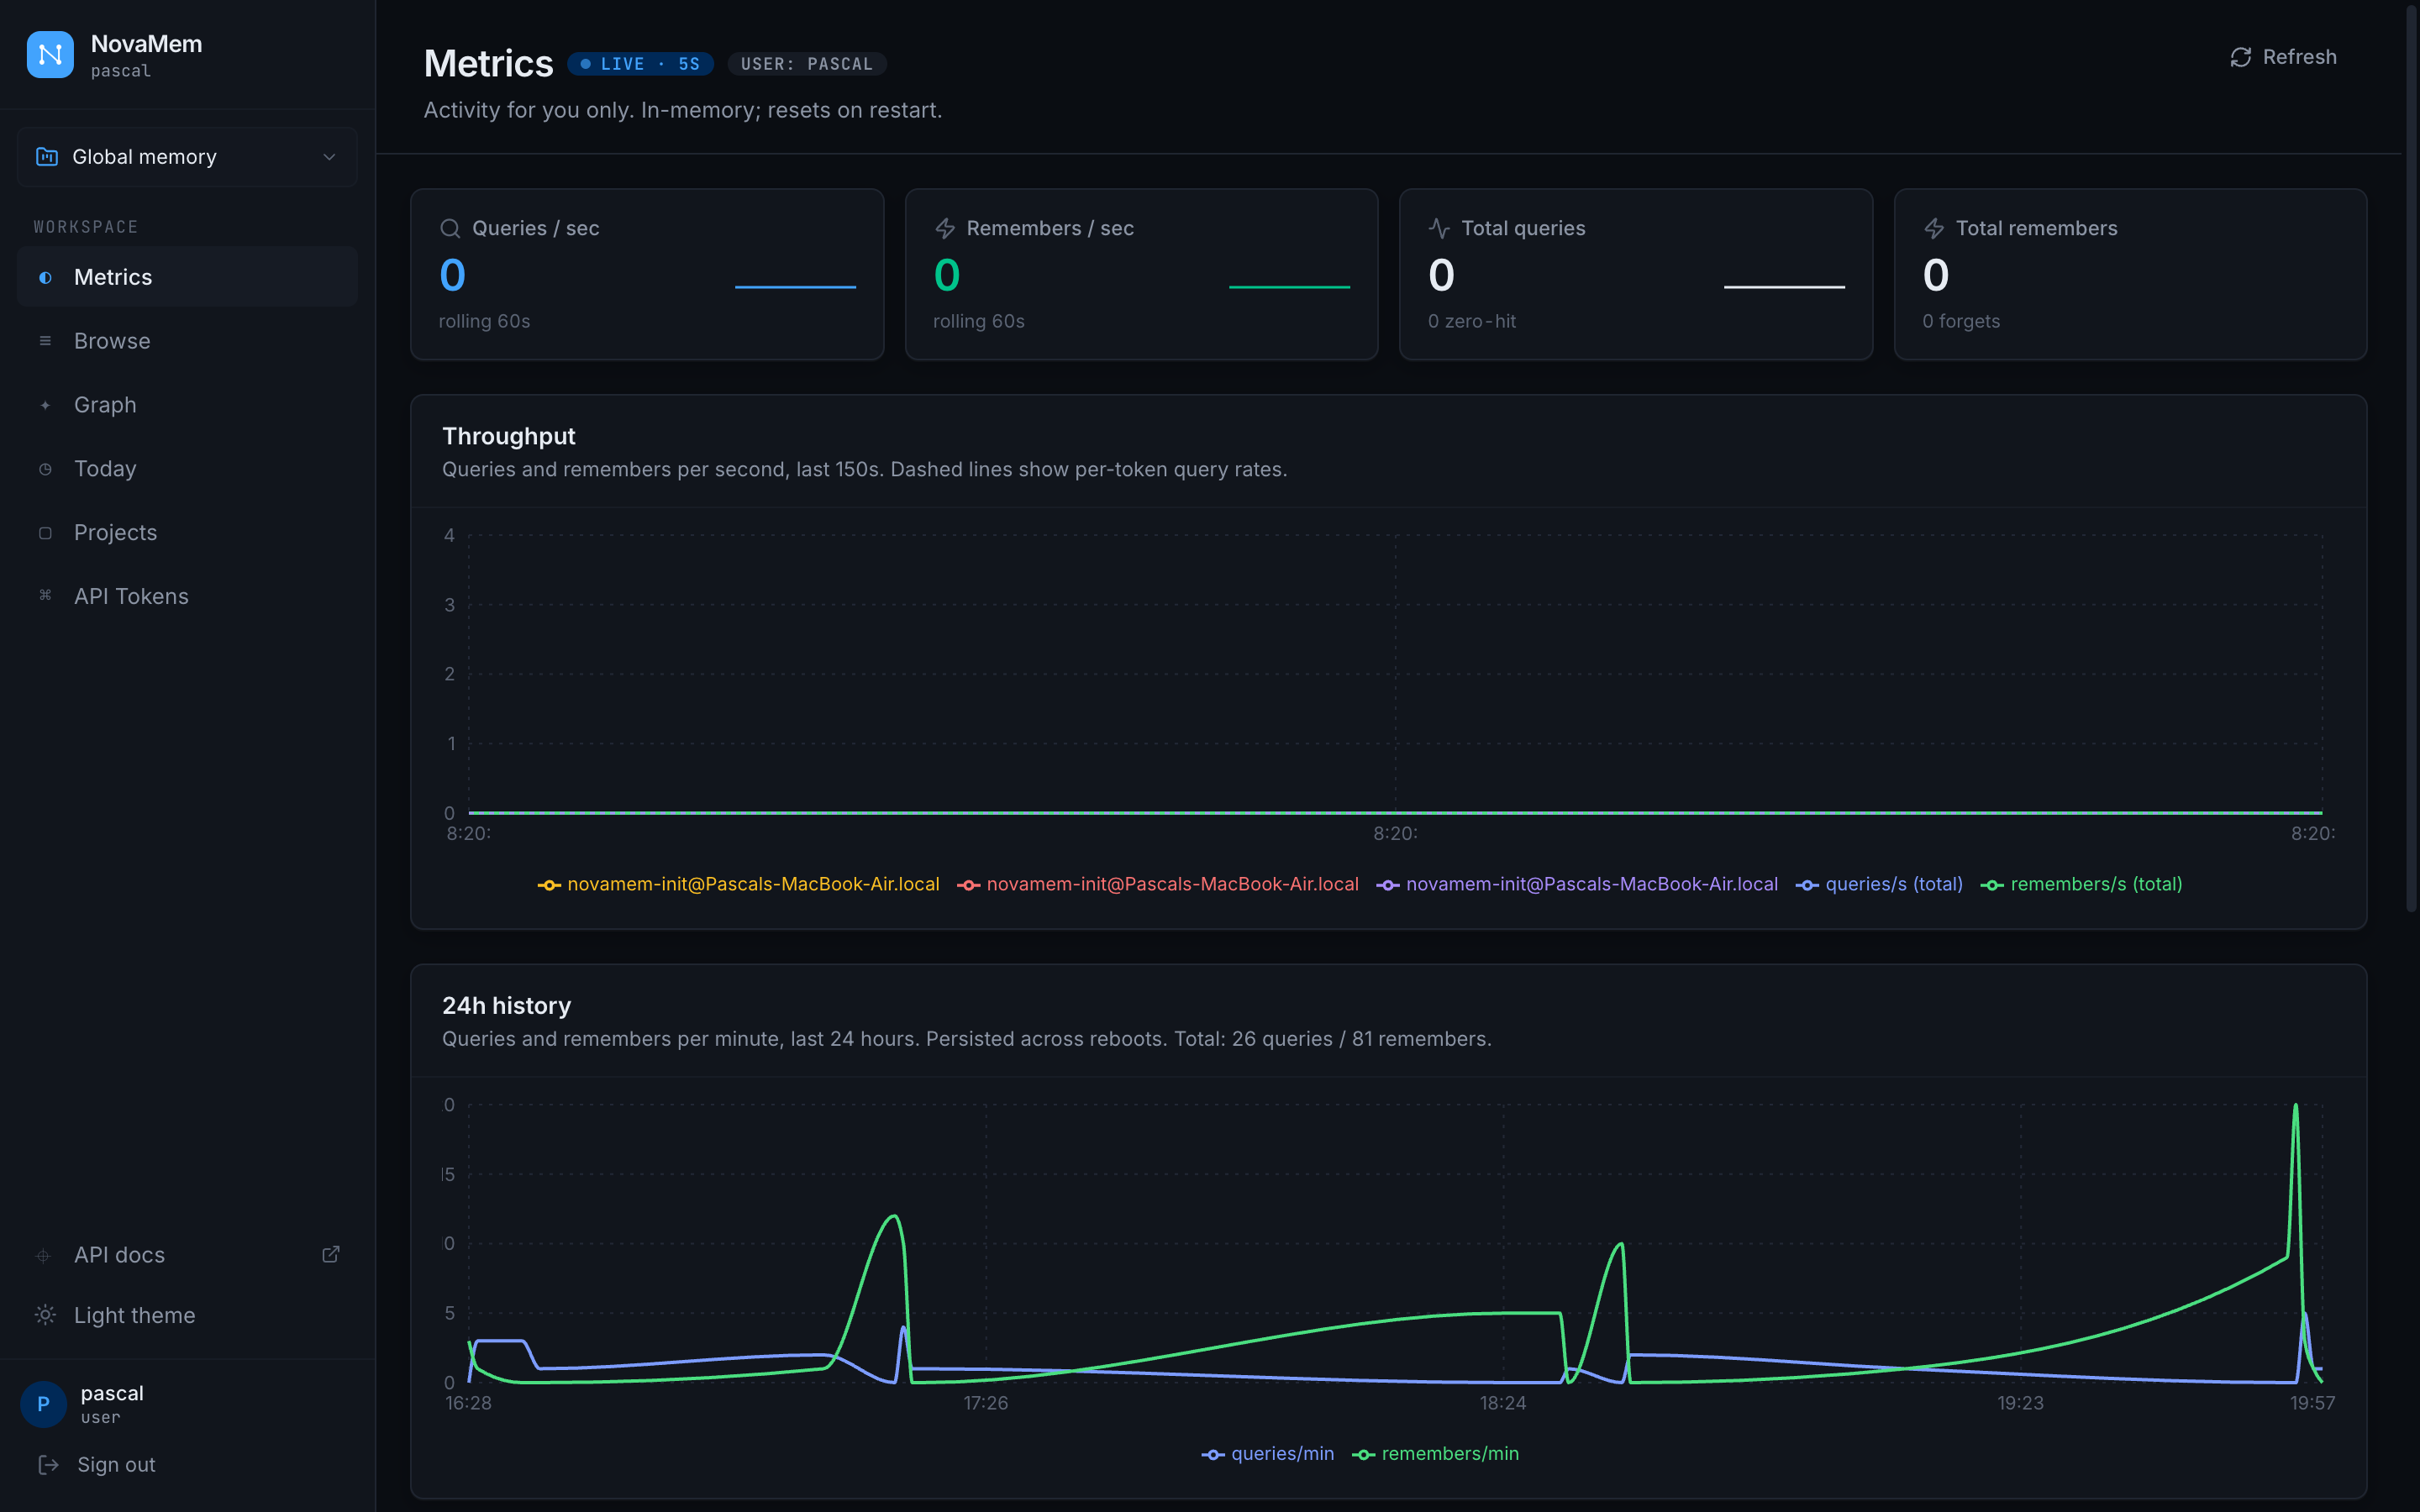
What's on the page
KPIs (top row)
- Queries / sec (60 s rolling) —
memory_searchcalls in the last minute. - Remembers / sec (60 s rolling) —
memory_remembercalls in the last minute. - Total queries — lifetime since process start; resets on restart. Includes a "zero-hit" sub-count.
- Total remembers — lifetime; subscript shows total forgets.
Throughput chart (live · 5 s polling)
Two solid lines (queries/sec, remembers/sec) plus a dashed line per token. For users this is your tokens; for admins it's all tokens in the tenant. The dashed lines let you see which token (laptop, CI runner, agent) is doing the work.
24 h history
Persistent buckets from the metrics_samples table — survive restarts. Read at page load; refresh by hand. Useful for spotting daily patterns + capacity planning.
Per-token usage
Lifetime + 60 s rolling rates per token. Token labels are the --token-label you passed to novamem-init. Click through to the API tokens page to revoke / mint.
Hits per tier
Of the queries that returned results, what fraction came from each tier (warm / cold / graph). High graph % means your memory is well-connected; high cold % means decay is moving entries off the warm tier (working as designed).
Store sizes
Counts for the calling user (or tenant for admins): warm entries, cold-only entries, graph edges. — means the underlying store is unreachable; check /health.
Admin vs user view
| User | Admin | |
|---|---|---|
| Scope | own bearers + own memory | tenant-aggregate |
| KPIs | queries/remembers attributed to user's tokens | every call across the tenant |
| Per-token table | user's tokens | every token in the tenant |
| Store sizes | user's entry counts | tenant totals |
How it's wired
Metrics are emitted by the engine on every search / remember / forget call. The MetricsCollector keeps:
- Global counters — process-wide.
- Per-tenant slots — created lazily; freed on tenant delete.
- Per-token slots — created lazily; freed on token revoke.
- TimestampRing — 60 s sliding window for rate calculation.
Counter increments are pure observation — never affect call behaviour. The 24 h history is flushed every minute via flushMetricsSamples() into Postgres.
See also
- API → Admin metrics — the
GET /v1/admin/metricsendpoint - Hardening — turning the dashboard off (
NOVAMEM_ADMIN_DASHBOARD=0)